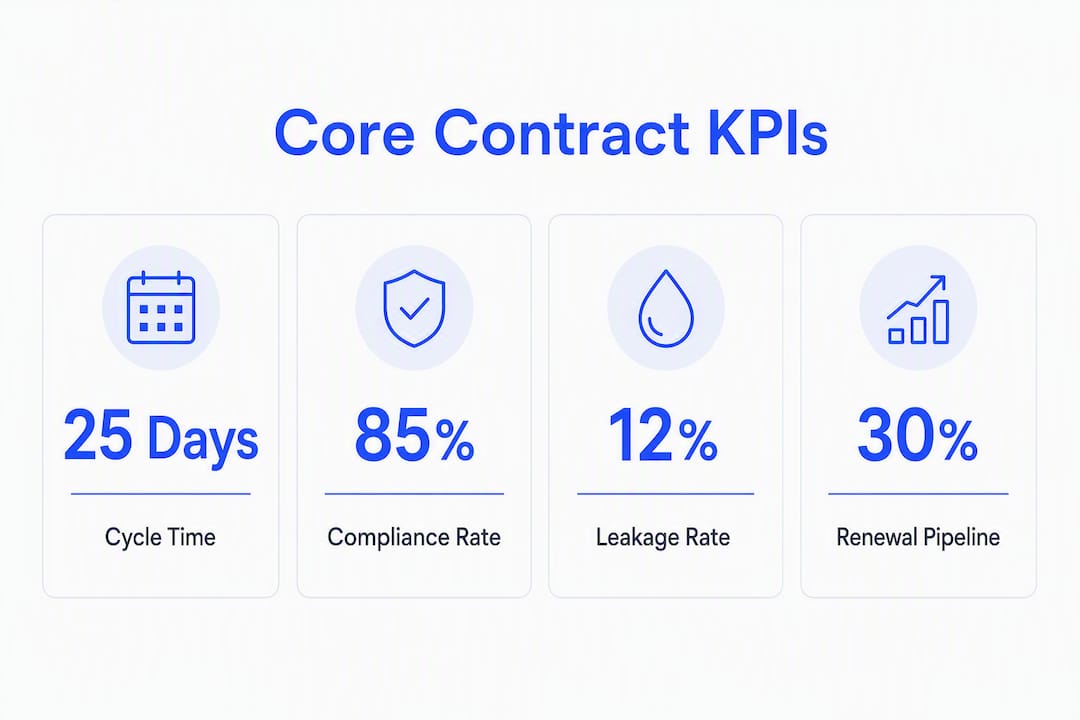
The six contract dashboard metrics worth tracking first are contract cycle time, time-to-sign, contract compliance rate, renewal pipeline, leakage rate, and obligations fulfilled. Best-in-class organizations route a high majority of total addressable spend through contracted suppliers; a compliance rate that is considered too low signals a process failure requiring attention. To start tracking these today: define exact KPI formulas and record them in a shared KPI dictionary, map your data sources (CLM, e-sign platform, ERP, CRM), and create at least two role-based views — one for the general counsel or legal ops lead, one for the procurement director or CFO. Tools like Formable feed time-to-sign and cycle time data directly from e-sign and review workflows, which shortens the time between "we want a dashboard" and "we have trustworthy numbers."
A practical headline set matters more than a comprehensive one. Dashboards that try to show every possible metric become difficult to use; the right starting point is four to six headline KPIs with drilldowns, not twenty metrics with no clear owner.
What is a contract dashboard and which types do teams build?
A contract dashboard is a live, role-based view of contract performance indicators pulled automatically from source systems — CLM, e-sign, ERP, CRM — and presented in a format that supports a specific decision.

The key phrase is "role-based." Single universal dashboards that try to serve every stakeholder often suffer low adoption because a general counsel needs different signals than a procurement director, and both need different signals than a contracts manager reviewing a queue. Building one dashboard for everyone usually means it is too noisy for anyone.
The six most common dashboard types, and who actually uses them:
| Dashboard type | Primary audience | Headline KPIs |
|---|---|---|
| Contract performance | Contracts manager, legal ops | Cycle time, time-to-sign, contracts by status |
| Executive / portfolio | GC, CFO, CPO | Total contract value, compliance rate, renewal pipeline |
| Legal operations | Legal ops director | Throughput, intake-to-assignment, outside counsel spend |
| Procurement | Procurement lead, category manager | On-contract spend, leakage rate, supplier compliance |
| Obligations / compliance | Compliance officer, contract admin | Obligations fulfilled, missed milestones, SLA breaches |
| Renewals pipeline | Account manager, legal ops | Days to renewal, auto-renewal flags, renewal rate |
Legal operations metrics cluster into spend, cycle time, volume, vendor management, and process adoption buckets, and mature teams track multiple buckets simultaneously. A procurement dashboard will lean heavily on spend and compliance buckets; a legal ops dashboard will weight throughput and vendor management. The table above reflects that split.
One practical note: most programs separate dashboards by role and ownership. CLM administrators own pipeline metrics, e-billing specialists own vendor metrics, and legal ops owns the consolidated executive view. Assigning ownership at build time prevents the "nobody updates this" failure mode that kills dashboard programs within six months.
Why contract dashboards pay off for legal, procurement, and contract teams
The business case for a contract dashboard comes down to four outcomes: visibility, speed, compliance, and leakage control.
Visibility is the foundational benefit. Without a dashboard, legal and procurement teams typically answer "how many contracts are active?" by running a spreadsheet query or asking someone. A live dashboard answers that question in seconds and surfaces contracts approaching renewal or breach before they become problems.
Faster cycle times follow from visibility. When a contracts manager can see exactly where each agreement sits in the workflow, they can intervene at the bottleneck rather than waiting for a counterparty to complain. For a GC, that means fewer escalations. For a CFO, it means revenue-generating agreements close sooner.

Leakage control is where the financial case becomes concrete. Contract leakage in organizations without real-time monitoring is commonly estimated at 5–15% of total contracted spend, with losses occurring through off-contract purchases, missed rebates, or untracked obligations. A dashboard that surfaces leakage signals weekly is not a reporting tool; it is a cost-recovery mechanism.
Compliance improvement matters to every stakeholder, but for different reasons. The GC cares about regulatory exposure and audit readiness. The CFO cares about realized contract value versus committed value. The procurement lead cares about supplier performance against contracted terms. A well-designed compliance dashboard gives each of them the view they need without requiring a custom report for every question.
Workload balancing is an underrated benefit. A contracts-by-status view lets a legal ops director see when one attorney is carrying 40 active reviews while another has 12, and redistribute before the overloaded attorney becomes a cycle-time bottleneck.
Core KPIs to put on your contract dashboard: definitions, formulas, and targets
The KPI dictionary below covers the four metric categories that matter most: lifecycle efficiency, compliance and leakage, value and renewal, and volume and aging. For each KPI, the formula uses explicit numerator and denominator so the numbers are comparable across teams and systems.
Lifecycle efficiency metrics
Cycle time and time-to-sign are the most-watched efficiency metrics, and they measure different things. Cycle time captures the full span from request to executed agreement; time-to-sign isolates only the signature window. Tracking both lets you locate bottlenecks precisely — a long cycle time with a short time-to-sign points to drafting or review delays, not a signing problem.
- Contract cycle time: (Date executed minus Date requested) / Number of contracts. Visualize as a trend line with a 30-day rolling average. Target: under 14 days for standard agreements; under 5 days for NDAs.
- Time-to-sign: (Date signed minus Date sent for signature) / Number of contracts. Visualize as a histogram. Target: under 48 hours for routine agreements.
- Intake-to-assignment: (Date assigned to attorney minus Date intake received) / Number of requests. Visualize as a card with a trend. Target: under 4 business hours.
- NDA cycle time: Same formula as contract cycle time, filtered to NDA contract type. Useful as a standalone card because NDAs are high-volume and often the first bottleneck a new dashboard program surfaces.
Compliance and leakage metrics
- Contract compliance rate (on-contract spend): (Spend through contracted suppliers / Total addressable spend) × 100. Visualize as a gauge or percentage card with a threshold line at 80%. Best-in-class target: 80–90%.
- Leakage rate: (Off-contract spend / Total addressable spend) × 100. Visualize as a trend line. Target: below 10%; alert threshold at 15%.
- Obligations fulfilled: (Obligations completed on time / Total obligations due in period) × 100. Visualize as a stacked bar by obligation type. Target: 95%+.
- Missed milestones / SLA breaches: Count of milestones or SLAs breached in period. Visualize as a count card with a drilldown to contract and obligation detail. Target: zero; alert on any breach.
Value and renewal metrics
- Contract value: Total committed value of active contracts. Visualize as a portfolio summary card, segmented by business unit or contract type.
- Value realized: (Invoiced or delivered value / Committed contract value) × 100. Visualize as a bar chart by supplier or contract. Pitfall: requires ERP invoice data linked to contract IDs — missing linkage is the most common data quality failure here.
- Renewal rate: (Contracts renewed / Contracts eligible for renewal in period) × 100. Visualize as a trend line. Target: above 85% for strategic supplier agreements.
- Auto-renewal pipeline: Count and value of contracts with auto-renewal clauses expiring within 60 and 90 days. Visualize as a table sorted by days to renewal. This is the metric that prevents the "we forgot to renew" call to a key supplier.
Volume and aging metrics
- Contracts by status: Count of contracts in each status (draft, under review, pending signature, executed, expired, terminated). Visualize as a stacked bar or donut chart. Pitfall: status labels must be standardized across the CLM; inconsistent naming inflates one bucket and deflates another.
- Contracts processed per month: Count of contracts reaching executed status in the calendar month. Visualize as a trend line. Useful for workload planning and capacity modeling.
- Contract aging distribution: Distribution of open contracts by age band (0–7 days, 8–30 days, 31–60 days, 60+ days). Visualize as a histogram. Contracts sitting in the 60+ band without a status change are the ones that need manual follow-up.
| KPI | Formula | Visualization | Target / benchmark | Data owner |
|---|---|---|---|---|
| Contract cycle time | (Date executed – Date requested) / Count | Trend line | Under 14 days (standard) | Legal ops |
| Time-to-sign | (Date signed – Date sent) / Count | Histogram | Under 48 hours | Legal ops / e-sign admin |
| Contract compliance rate | (On-contract spend / Total addressable spend) × 100 | Gauge / % card | 80–90% | Procurement |
| Leakage rate | (Off-contract spend / Total addressable spend) × 100 | Trend line | Below 10% | Procurement |
| Obligations fulfilled | (On-time obligations / Total due) × 100 | Stacked bar | 95%+ | Contract admin |
| Renewal rate | (Renewed / Eligible) × 100 | Trend line | 85%+ | Legal ops / account mgmt |
| Contracts by status | Count per status | Donut / stacked bar | N/A | CLM admin |
| Contract aging | Count per age band | Histogram | 0 in 60+ band | Contracts manager |
CLM adoption rate, template usage rate, and playbook reuse are three additional process adoption metrics worth adding once the headline set is stable. They measure how much of your contracting activity runs through controlled processes, which directly predicts compliance and speed outcomes.
How to design a contract dashboard that people actually use
The most common reason dashboards fail is not bad data. It is that the dashboard was built before anyone asked what decision it needed to support.
Start with the audience and the decision
Before choosing a visualization, write down the one decision each role needs to make from the dashboard. A contracts manager needs to answer: "Which contracts need my attention today?" A procurement director needs to answer: "Are we on track for compliance and spend targets this quarter?" A GC needs to answer: "What is our risk exposure and where are we slow?" Each answer requires a different layout and a different headline metric row.
Layout structure
A reliable layout follows four layers:
- Headline metrics row — four to six KPI cards at the top, each showing current value, trend direction, and threshold status (green / amber / red).
- Secondary trends panel — two or three trend lines showing the same KPIs over a rolling 90-day window.
- Detail table — a filterable list of contracts with status, owner, days open, and next action date.
- Alerts drawer — a persistent panel showing contracts that have breached a threshold, sorted by severity.
Filtering and drilldown recommendations
Default filters should include contract type, business unit, counterparty, and time window. A contracts manager reviewing a queue will filter by type and owner; a CFO will filter by business unit and value band. Build these as default saved views rather than requiring users to configure them each session.
Drilldowns matter most for compliance rate and cycle time. A compliance rate card that shows 74% is useful; a drilldown that shows which three business units are pulling the number down is what drives action.
Alert and threshold design
Set thresholds at two levels: an amber warning (approaching the limit) and a red alert (breach confirmed). For compliance rate, amber at 75% and red at 70% gives teams time to intervene before the number becomes a board-level conversation. For missed milestones, any breach should trigger a red alert immediately.
Alert fatigue is a real risk. If every metric fires an alert every week, users stop reading them. Limit automated alerts to the four or five metrics with the clearest remediation path, and route them to the role that can actually act on them.
Pro Tip: Review your dashboard's KPI dictionary and alert thresholds every quarter. Metric definitions drift when teams change systems or redefine contract types, and a threshold that made sense at launch may be miscalibrated six months later. A 30-minute quarterly review prevents months of misleading numbers.
Where dashboard data comes from and how to keep it trustworthy
A contract dashboard is only as reliable as the data feeding it. Most teams pull from five or six source systems, and each one introduces its own data quality risks.
Common source systems and what they provide:
- CLM platform — contract dates (created, executed, expiry), template tags, contract type, owner, counterparty, status. This is the primary source for cycle time, aging, and volume metrics.
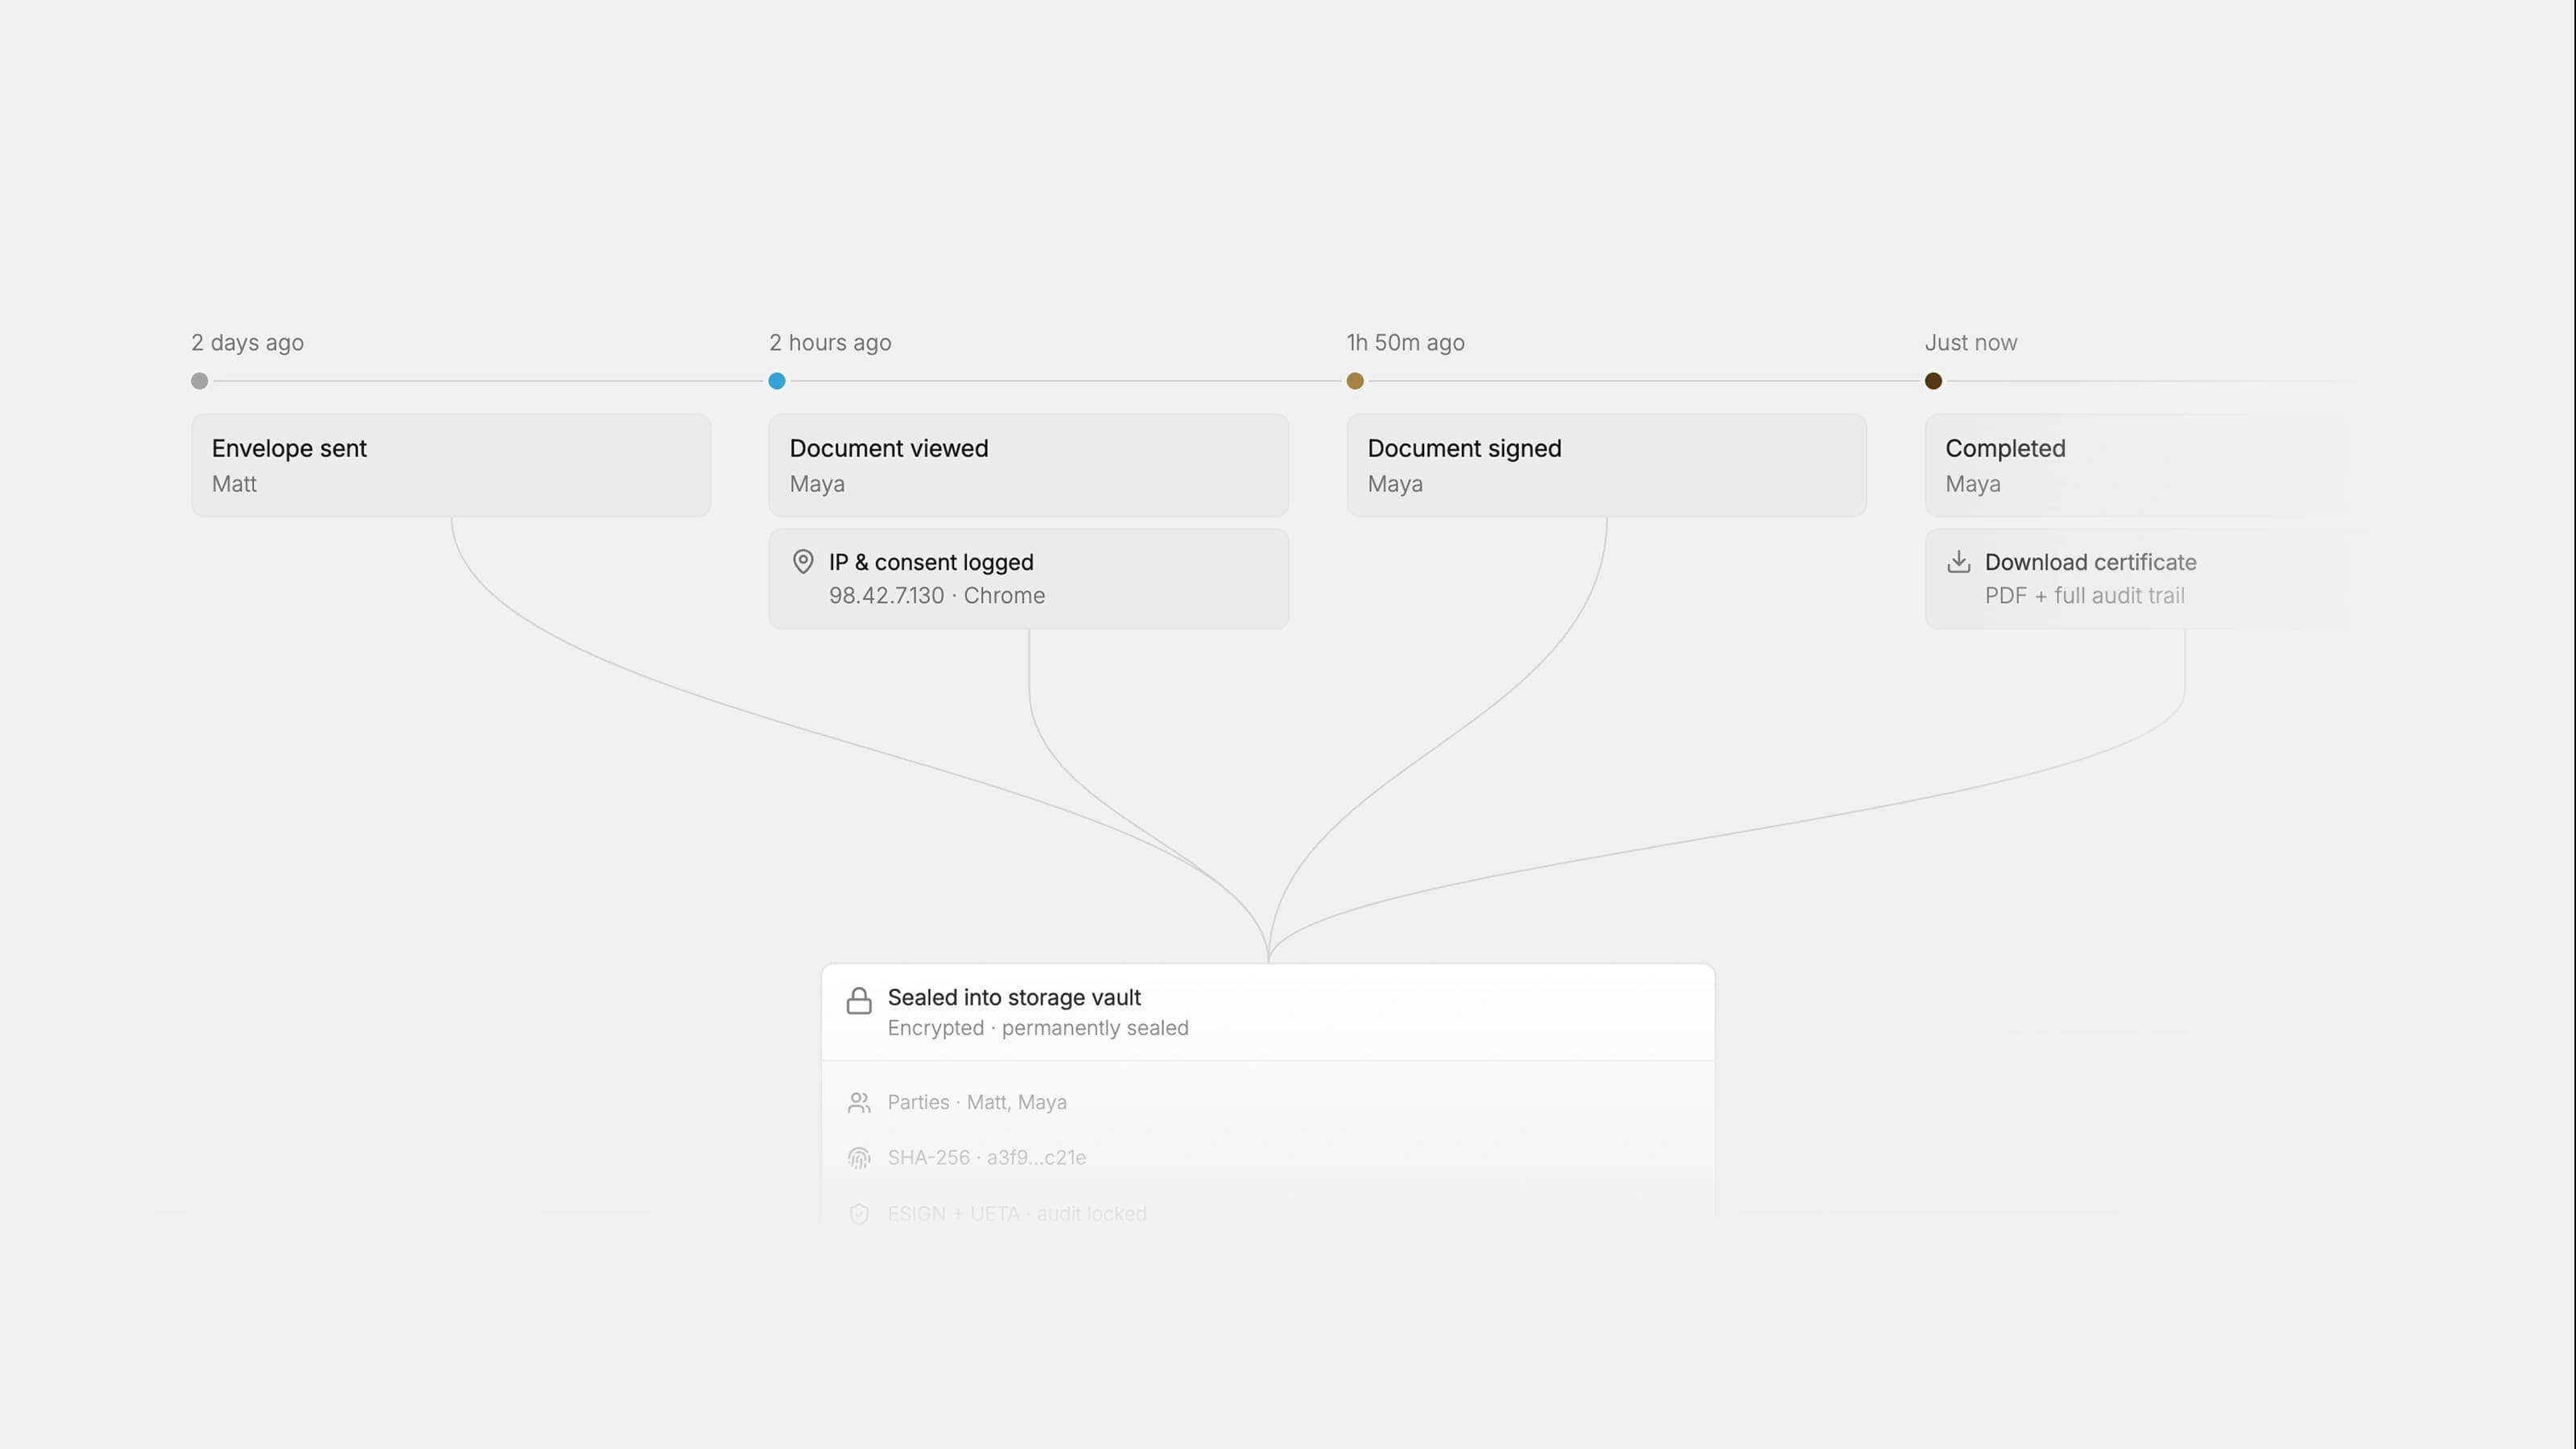
- E-sign platform — sent timestamp, viewed timestamp, signed timestamp. The primary source for time-to-sign. Formable's e-sign capabilities capture these events at the transaction level, making time-to-sign calculation straightforward.
- CRM — opportunity value, account owner, deal stage. Links contract value to revenue pipeline; essential for value realized and renewal rate when contracts originate from sales.
- ERP / procurement system — purchase orders, invoices, supplier payments. Required for on-contract spend and leakage calculations. This is the hardest integration to get right because ERP data often lacks a contract ID foreign key.
- E-billing / matter management — outside counsel invoices, matter spend. Feeds vendor management and legal spend KPIs in a legal ops dashboard.
- SSO / HR system — contract owner, approver, business unit. Needed for workload distribution and role-based filtering.
Integration patterns range from direct API connections (fastest, near-real-time) to scheduled ETL jobs (daily or weekly batch) to manual CSV uploads (last resort, high error rate). API-based integrations to CLM and e-sign platforms can typically be completed in days; reconciling financial data from ERP often requires field mapping, currency normalization, and legal-side validation, which is the primary time and cost driver in most dashboard programs.
Data quality checklist:
- Every contract has a unique, immutable contract ID that persists across system migrations.
- Counterparty names are stored in canonical form (one record per legal entity, not "Acme Corp," "Acme Corporation," and "ACME").
- Contract types use a controlled vocabulary, not free-text fields.
- All dates are stored in a single timezone-normalized format.
- Currency fields include the ISO currency code, not just a numeric value.
- A reconciliation routine runs weekly to flag contracts present in one system but missing in another.
Data governance elements like unique contract IDs, canonical counterparty names, template tagging, and date normalization are the difference between a dashboard that drives decisions and one that generates arguments about whether the numbers are right.
A shared KPI dictionary with versioning prevents metric drift and supports consistent cross-departmental reporting. Assign one named owner to each metric definition, and require a documented change request before any formula is modified. That discipline sounds bureaucratic until the first time a CFO and a GC present conflicting compliance numbers in the same board meeting.
Implementation checklist: from pilot to enterprise rollout
Step-by-step roadmap
- Discovery — Interview two to three stakeholders per role (GC, procurement director, contracts manager). Document the three decisions each role needs the dashboard to support.
- Data mapping — Inventory source systems, confirm API availability, and identify gaps (missing contract IDs, unlinked ERP records).
- KPI definition — Write the KPI dictionary: formula, data source, owner, refresh cadence, and threshold values for each metric.
- Prototype — Build a low-fidelity mockup (even a static slide deck) showing the headline metrics row and one drilldown. Validate with stakeholders before writing any code.
- Pilot — Deploy a minimally viable dashboard (MVD) with four headline KPIs and a renewal pipeline table to one business unit. Run for six to eight weeks.
- Iterate — Collect feedback, fix data quality issues surfaced during the pilot, and adjust thresholds based on observed distributions.
- Departmental rollout — Expand to the full legal or procurement team with role-based views.
- Enterprise integration — Connect remaining source systems (ERP, HR, e-billing) and enable cross-departmental reporting.
Timeline bands
- Quick pilot (4–8 weeks): Four headline KPIs, one role-based view, CLM and e-sign data only.
- Full departmental rollout (3–6 months): All KPI categories, multiple role-based views, CRM integration.
- Enterprise integration (6–12 months): ERP and e-billing connected, cross-departmental reporting, automated alerts.
Cost drivers
- Data integration complexity — the number of source systems and the quality of their APIs.
- Source-system licensing — some CLM and ERP platforms charge for API access or data export.
- Visualization tool — Power BI, Tableau, Looker, and embedded options vary in licensing cost and engineering effort.
- Data governance staffing — someone needs to own the KPI dictionary and run reconciliation routines.
- Engineering effort — custom field mapping and currency normalization add weeks to ERP integrations.
MVD acceptance criteria for pilot success: cycle time data populates without manual entry, compliance rate matches the procurement team's manual calculation within 2 percentage points, and at least two stakeholders confirm they would use the dashboard weekly without prompting.
How to act on what your dashboard tells you
A dashboard that surfaces a problem without a response protocol is just a reporting tool. The playbook below converts four common alert signals into repeatable operational steps.
Low compliance rate (below 75%)
Immediate checks: Confirm the denominator is correct — total addressable spend should exclude non-addressable categories. Check whether a recent system migration changed how spend is tagged. Verify that the ERP-to-contract ID linkage is intact.
Short-term fixes: Send targeted reminders to the three business units with the lowest on-contract spend. Review whether preferred suppliers are visible in the procurement portal. Run a one-hour training session on the contract request process for the teams showing the highest off-contract spend.
Medium-term remediation: Redesign the procurement intake workflow to make off-contract purchasing harder than on-contract purchasing. Add a contract compliance metric to supplier scorecards. Assign a compliance owner for each major spend category.
Long cycle time (above 21 days for standard agreements)
- Pull the cycle time breakdown by stage: intake-to-assignment, assignment-to-first-draft, first-draft-to-redline-complete, redline-to-sign.
- Identify which stage accounts for the majority of elapsed time.
- If the bottleneck is drafting, check template coverage — contracts drafted from templates close faster than those drafted from scratch.
- If the bottleneck is redlining, check whether both parties are using a collaborative review tool or exchanging Word documents by email.
- If the bottleneck is signing, check whether the e-sign platform is configured for parallel rather than sequential signing.
Missed renewals
Immediate: Flag all contracts with auto-renewal clauses expiring within 30 days. Assign an owner to each and confirm intent (renew, renegotiate, or terminate).
Short-term: Set dashboard alerts at 90 days and 60 days before expiry for all contracts above a defined value threshold. Route alerts to the contract owner and their manager.
Medium-term: Add a renewal decision workflow to the CLM so that every contract approaching expiry triggers a structured review, not just an email reminder.
High leakage rate (above 10%)
Escalation matrix:
| Leakage rate | First response | Escalation |
|---|---|---|
| 10–14% | Procurement manager reviews off-contract spend report within 5 business days | None |
| 15% | Procurement director reviews within 2 business days | Notify CFO |
| above 15% | Immediate procurement director review | CFO and GC notified same day |
Recurring leakage above 15% for two consecutive quarters should be converted into a formal project workstream with a defined target, a named owner, and a monthly dashboard review. Measure remediation success by tracking the leakage rate trend line on the dashboard itself — a downward trend over 90 days confirms the intervention is working.
Industry benchmarks, research targets, and KPI governance
High-confidence benchmarks
The most defensible benchmark in contract management is the compliance rate range. Best-in-class organizations route 80–90% of total contracted spend through contracted suppliers, and a rate below 70% consistently signals either process gaps or awareness failures. These figures come from cross-industry data and apply most cleanly to indirect procurement; direct materials and highly regulated categories may show different distributions.
Leakage estimates carry more variance. The 5–15% leakage range is a widely cited industry estimate for organizations without real-time monitoring, but the actual figure depends heavily on procurement maturity, contract mix, and how "addressable spend" is defined. Use it as a directional target, not a precise benchmark.
For cycle time, no single cross-industry benchmark has the same authority as the compliance figures. NDA cycle times under five days and standard MSA cycle times under 14 days are practical targets used by legal ops teams at mid-market companies, but they vary by industry, counterparty type, and negotiation complexity.
Translating benchmarks into staged targets
A compliance rate of 65% does not need to reach 85% in one quarter. A staged approach works better: set a 6-month target of 72%, a 12-month target of 78%, and a 24-month target of 85%. Each stage gives the team a concrete improvement goal and a dashboard threshold to track against.
Legal operations metrics mature in stages: early-stage teams track volume and cycle time; mid-stage teams add compliance and spend; mature teams add vendor management and process adoption metrics. Align your benchmark targets to your maturity stage rather than jumping to enterprise-level targets before the data infrastructure supports them.
KPI governance recommendations
- Maintain a versioned KPI dictionary in a shared location (a wiki, a CLM metadata field, or a governance document in your contract repository).
- Assign one named metric owner per KPI — the person responsible for the formula, the data source, and the threshold values.
- Set a reporting cadence per metric type: operational metrics (cycle time, aging) refresh daily; compliance and spend metrics refresh weekly; portfolio and value metrics refresh monthly.
- Require a documented change request before modifying any formula. A formula change without documentation is indistinguishable from a data quality problem when you review trends six months later.
A shared KPI dictionary with versioning prevents metric drift and allows consistent cross-departmental reporting — the single governance rule that pays the highest return relative to the effort required to implement it.
How Formable supports contract dashboard metrics
Formable's capabilities map directly to the headline KPIs that matter most to legal, procurement, and contract teams. The platform covers the full contract workflow — from AI-powered review and playbook-based risk detection at intake, through collaborative redlining and negotiation, to e-sign and audit trail capture — which means the data that feeds your dashboard is generated within a single system rather than assembled from disconnected point tools.
| Capability | What it solves | KPIs improved | Deployment note |
|---|---|---|---|
| AI contract review and playbooks | Catches risks and missing clauses at intake; enforces standard positions | Compliance rate, obligations fulfilled, missed milestones | Upload playbooks at setup; review runs automatically on intake |
| Collaborative redlining and negotiation | Both parties align on terms in one workspace, not email threads | Time-to-sign, contract cycle time, NDA cycle time | Invite counterparty to redline session; no additional software required |
| E-sign and e-sign API | Captures sent, viewed, and signed timestamps at the transaction level | Time-to-sign, cycle time, auto-renewal pipeline | API integration available for developers embedding e-sign in existing platforms |
| Template library and contract creator | Standardizes agreement structure; tracks template usage and playbook reuse | Template usage rate, CLM adoption rate, drafting cycle time | Import existing templates; generative AI assists with clause population |
| Audit trail and review workflows | Immutable record of every review, approval, and signature event | Obligations fulfilled, compliance rate, audit readiness | Enabled by default; exportable for regulatory inquiries |
For teams ready to run a pilot, a practical quick-start sequence looks like this:
- Define four headline KPIs and write their formulas in a shared KPI dictionary.
- Connect Formable's e-sign and review workflows to capture time-to-sign and cycle time data from day one.
- Import your standard agreement templates (NDAs, MSAs, SOWs) into the contract creator to start tracking template usage rate.
- Set up two role-based dashboard views: one for the contracts manager (cycle time, aging, contracts by status) and one for the GC or procurement director (compliance rate, renewal pipeline, leakage rate).
- Run the pilot for six to eight weeks, then compare cycle time and compliance rate against your pre-pilot baseline.
Formable's AI-powered contract review is particularly relevant for compliance and obligations metrics. When every incoming contract is reviewed against a standard playbook at intake, the data needed to calculate obligations fulfilled and missed milestones is captured automatically rather than reconstructed from email threads after the fact.
Key takeaways
The highest-impact first build is a role-based dashboard with four headline KPIs (cycle time, compliance rate, renewal pipeline, leakage rate) and a written KPI dictionary. Map your data sources, run a 6–8 week pilot, and measure improvement against a documented baseline.
| Point | Details |
|---|---|
| Start with four headline KPIs | Cycle time, compliance rate, renewal pipeline, and leakage rate cover the most critical signals without overloading the dashboard. |
| Best-in-class compliance target | Best-in-class organizations reach 80–90% on-contract spend; below 70% signals a process problem requiring immediate attention. |
| Leakage is a cost-recovery lever | Organizations without real-time monitoring lose 5–15% of contracted spend to leakage; a dashboard surfaces this weekly. |
| Role-based views drive adoption | Single universal dashboards suffer low adoption; build separate views for the GC, procurement director, and contracts manager. |
| Formable as implementation path | Formable captures cycle time, time-to-sign, compliance, and obligations data within one workflow, reducing integration complexity for a pilot. |
A practical note on measurement discipline
Most contract dashboard programs fail not because the technology is wrong, but because the measurement discipline is absent. Teams rush to build visualizations before they have agreed on what a "contract cycle time" actually means in their organization. Does the clock start at intake submission or at attorney assignment? Does it stop at execution or at countersignature? These are not trivial questions. Two teams using the same formula label but different start and end events will produce numbers that cannot be compared, and the dashboard becomes a source of disagreement rather than alignment.
The advice worth repeating: start small, lock the formulas before you build anything, assign a named owner to each metric, and review the dashboard cadence quarterly. A dashboard with four well-defined KPIs that everyone trusts is more useful than a dashboard with twenty metrics that generate weekly arguments about methodology.
Metric bloat is the other failure mode. Every stakeholder who joins the dashboard program will suggest adding "just one more metric." Some of those suggestions are valid. Most are not. The test is simple: if you cannot name the decision the metric supports and the person who will act on it, the metric does not belong on the dashboard. It belongs in a drilldown, or not at all.
The teams that get the most value from contract dashboards are the ones that treat the KPI dictionary as a living governance document, not a one-time setup task. Quarterly reviews, versioned formulas, and named owners are not overhead. They are what keeps the dashboard credible twelve months after launch.
Ready to instrument your contract dashboard with Formable?
Tracking contract dashboard metrics requires clean data from the moment a contract enters your workflow. Formable gives legal and procurement teams a single platform where AI review, collaborative redlining, e-sign, and audit trails all generate the timestamps and compliance signals your dashboard needs — without stitching together five separate tools.
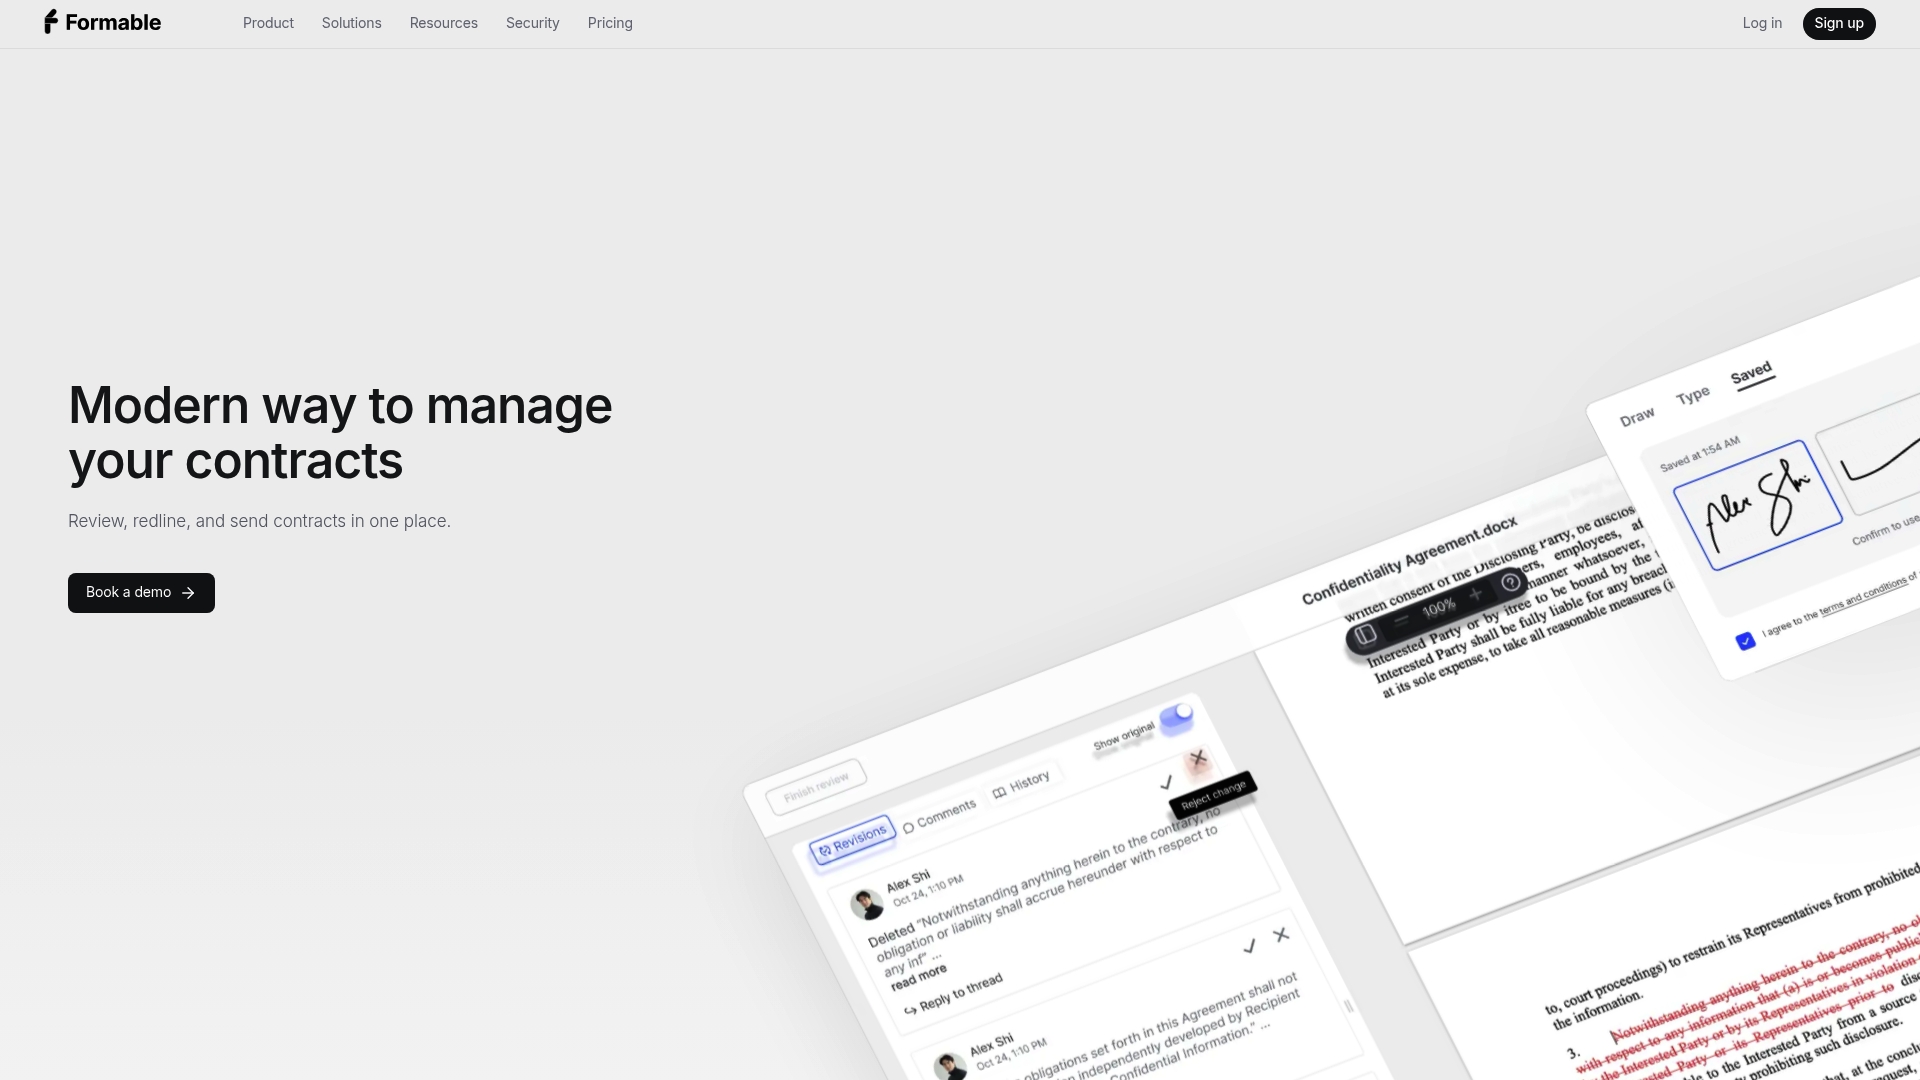
Teams that pilot Formable typically configure their first two role-based dashboard views within the first two weeks: one for cycle time and aging, one for compliance rate and renewal pipeline. The contract management platform supports fast onboarding with template import, playbook upload, and API-based e-sign integration. If you want to see how Formable maps to your specific KPI set, reach out and the team will walk through your use case directly.
Recommended sources and further reading
A short list of the most useful resources for executive briefings and deeper dives on contract management metrics and dashboard design:
- Legal operations KPIs and metrics 2026 — HireLegalOps: Comprehensive coverage of legal ops KPI categories and maturity stages.
- Measure what matters: a strategic approach to legal operations metrics — Wolters Kluwer: Strong guidance on iterative dashboard design and data governance.
- Legal Operations KPIs — LegalOpsKPIs: Reference resource for KPI dictionary governance and metric versioning.
- Formable — Modern way to manage contracts: Product overview covering AI review, redlining, e-sign, templates, and dashboard capabilities.
FAQ
What are the most important metrics on a contract dashboard?
The core set is contract cycle time, time-to-sign, contract compliance rate, renewal pipeline, leakage rate, and obligations fulfilled. Start with these four to six before adding secondary metrics.
What is a contract compliance rate and what is a good target?
Contract compliance rate measures the percentage of total addressable spend routed through contracted suppliers. Best-in-class organizations reach 80–90%; a rate below 70% signals process or awareness gaps that need immediate attention.
What are the main types of contract dashboards?
The six most common types are contract performance, executive/portfolio, legal operations, procurement, obligations/compliance, and renewals pipeline. Each is built for a different audience and highlights different KPIs.
What KPIs should a legal operations dashboard track?
Legal ops dashboards typically track throughput (contracts processed per month), cycle time, intake-to-assignment time, outside counsel spend, and process adoption metrics like CLM adoption rate and template usage rate. The right mix depends on the team's maturity stage.
How does Formable help with contract dashboard metrics?
Formable captures the timestamps and compliance signals that feed headline KPIs — time-to-sign from e-sign events, cycle time from review and redlining workflows, and compliance data from AI playbook reviews — within a single platform, reducing the integration work needed to build a trustworthy dashboard.